Past Research and Projects
Surface Observations and Convective Initiation
My PhD thesis work investigates how assimilating standard surface weather observations at high spatial and temporal frequency may improve short-term storm-scale forecasts of convective initation.
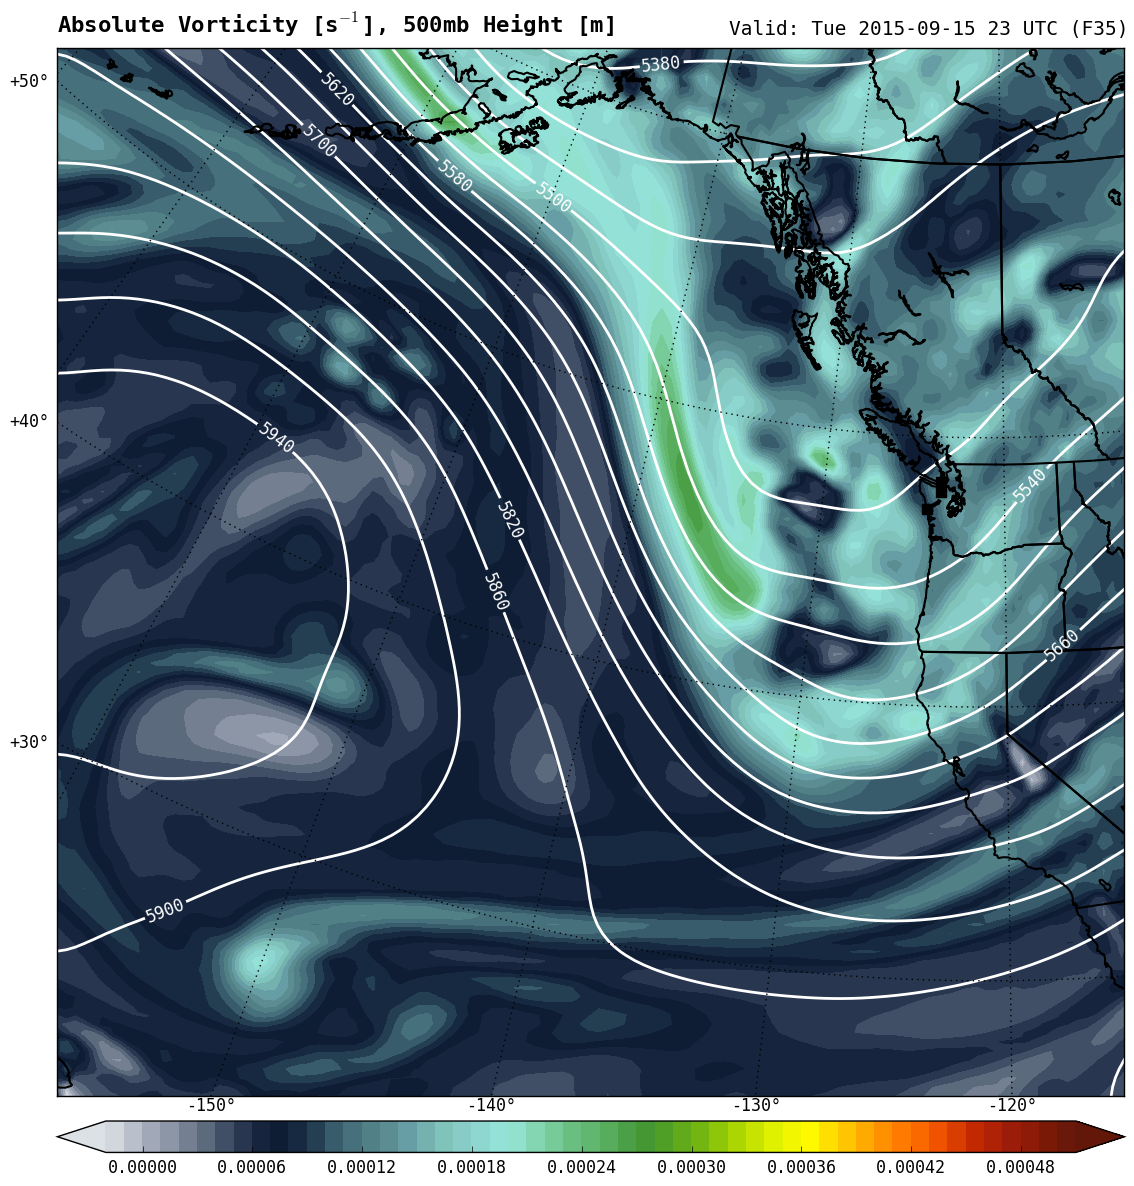
Olympex Forecasting
As a lead forecaster for the Olympex Field Campaign, I've been creating forecast graphics to support operational weather briefings. These graphics include output from our UW Local WRF model runs, regional radar composites, and sounding plots.
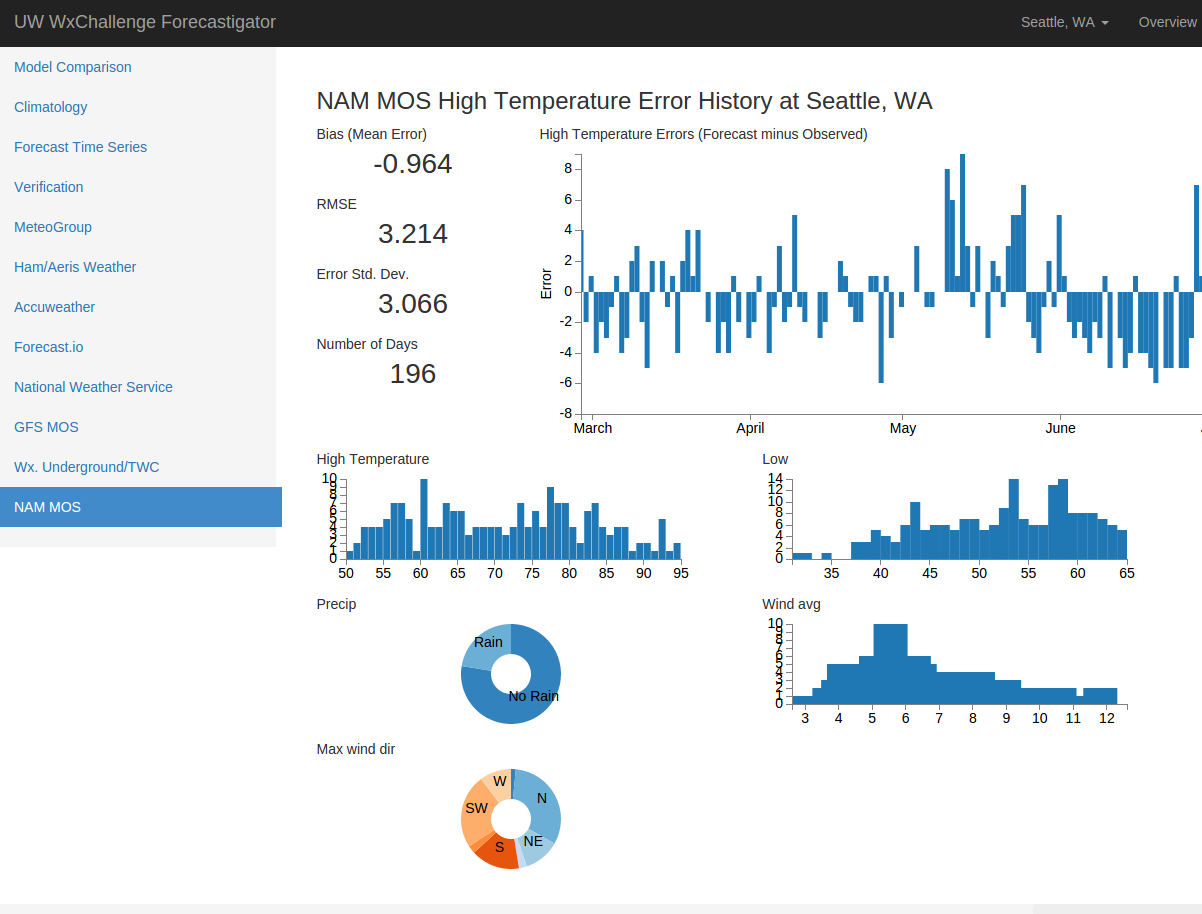
Local Forecast Verification
What started as a project to help our UW WxChallenge forecast team has expanded into a long-term, forecast verification project that aggregates and verifies public and private point next-day point forecasts in an interactive, web-based environment. I have a work-in-progress sample website showing some of these verification statistics.
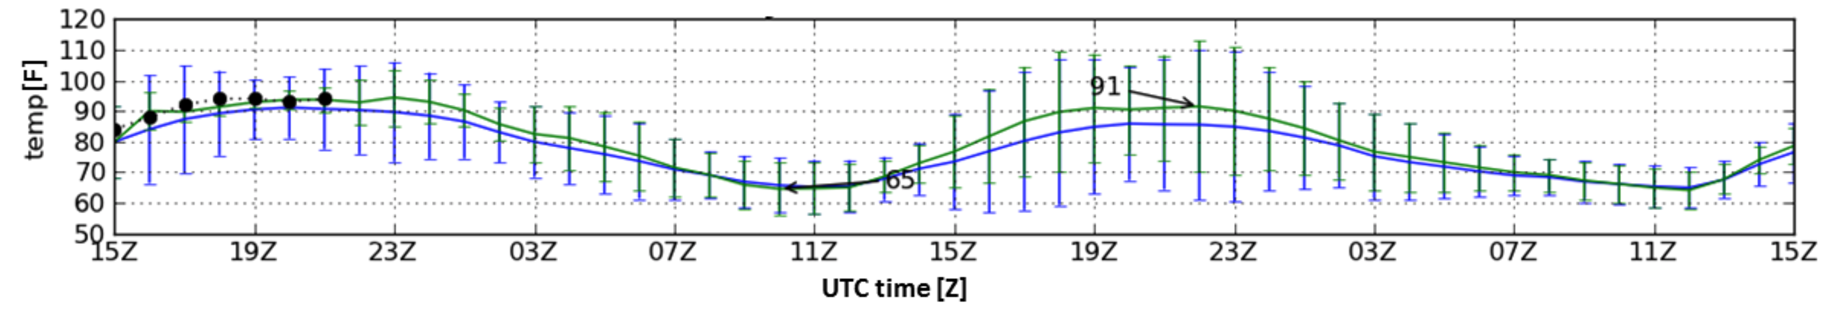
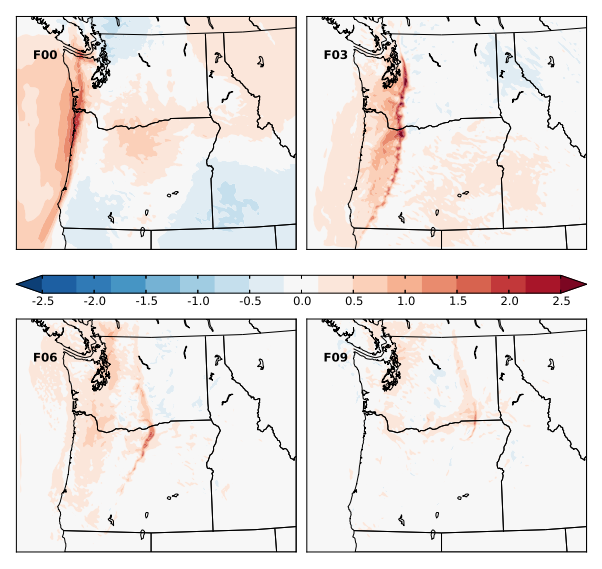
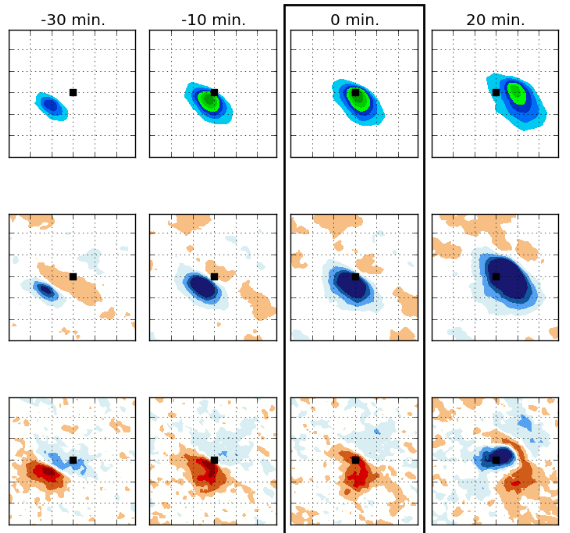
Ensemble Forecast Adjustment
I explored a method that allows new observations to rapidly update ensemble forecasts at the time of data assimilation. This method showed promise in improving 6-18 hour forecasts of surface temperature and pressure in global ensemble forecasts. I'm currently expanding this work to examine the potential for EFA to work with mesoscale ensembles. See the iPython Notebook demonstration below for a better example of how the method works.
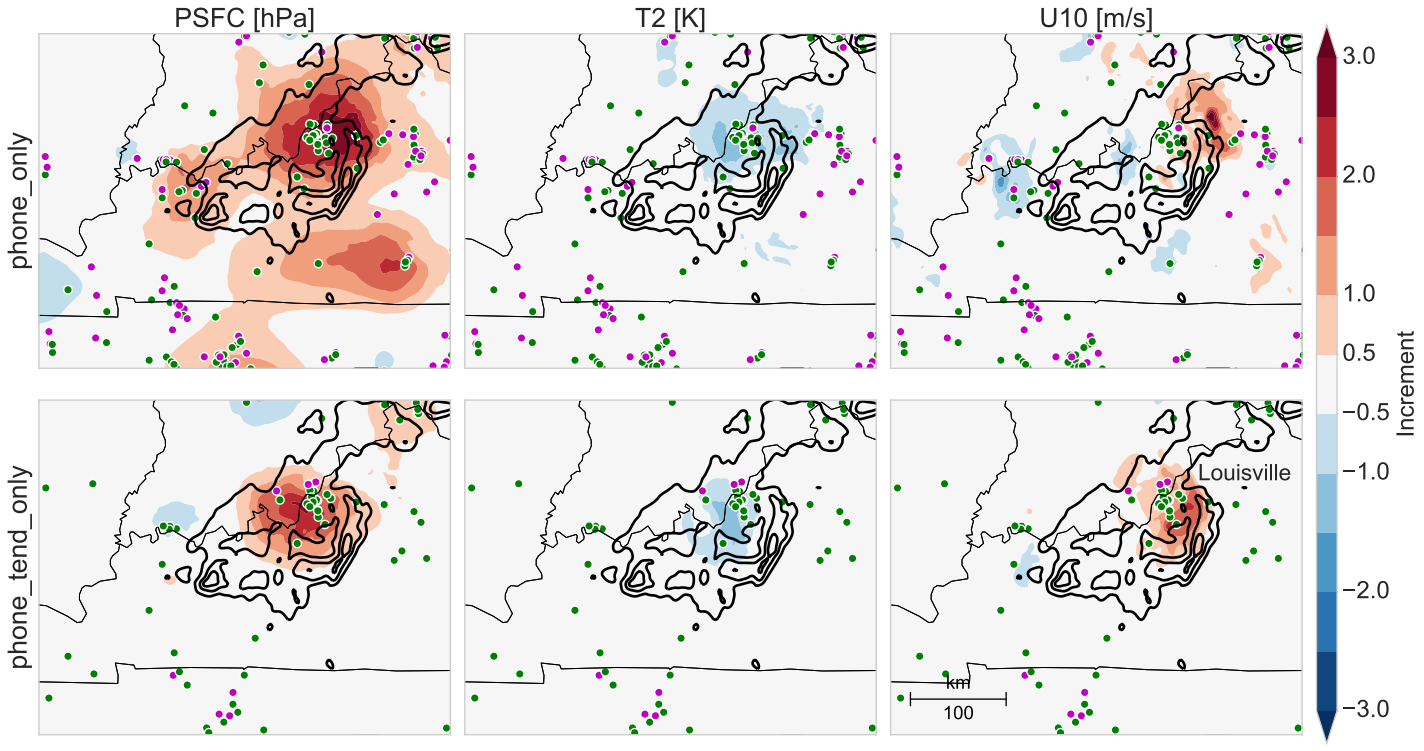
Smartphone Pressure Observations